The Bar Chart is the central component of your trading interface, providing a detailed view of market activity. Below are its key features and functionalities:
Main Area of Trader Display
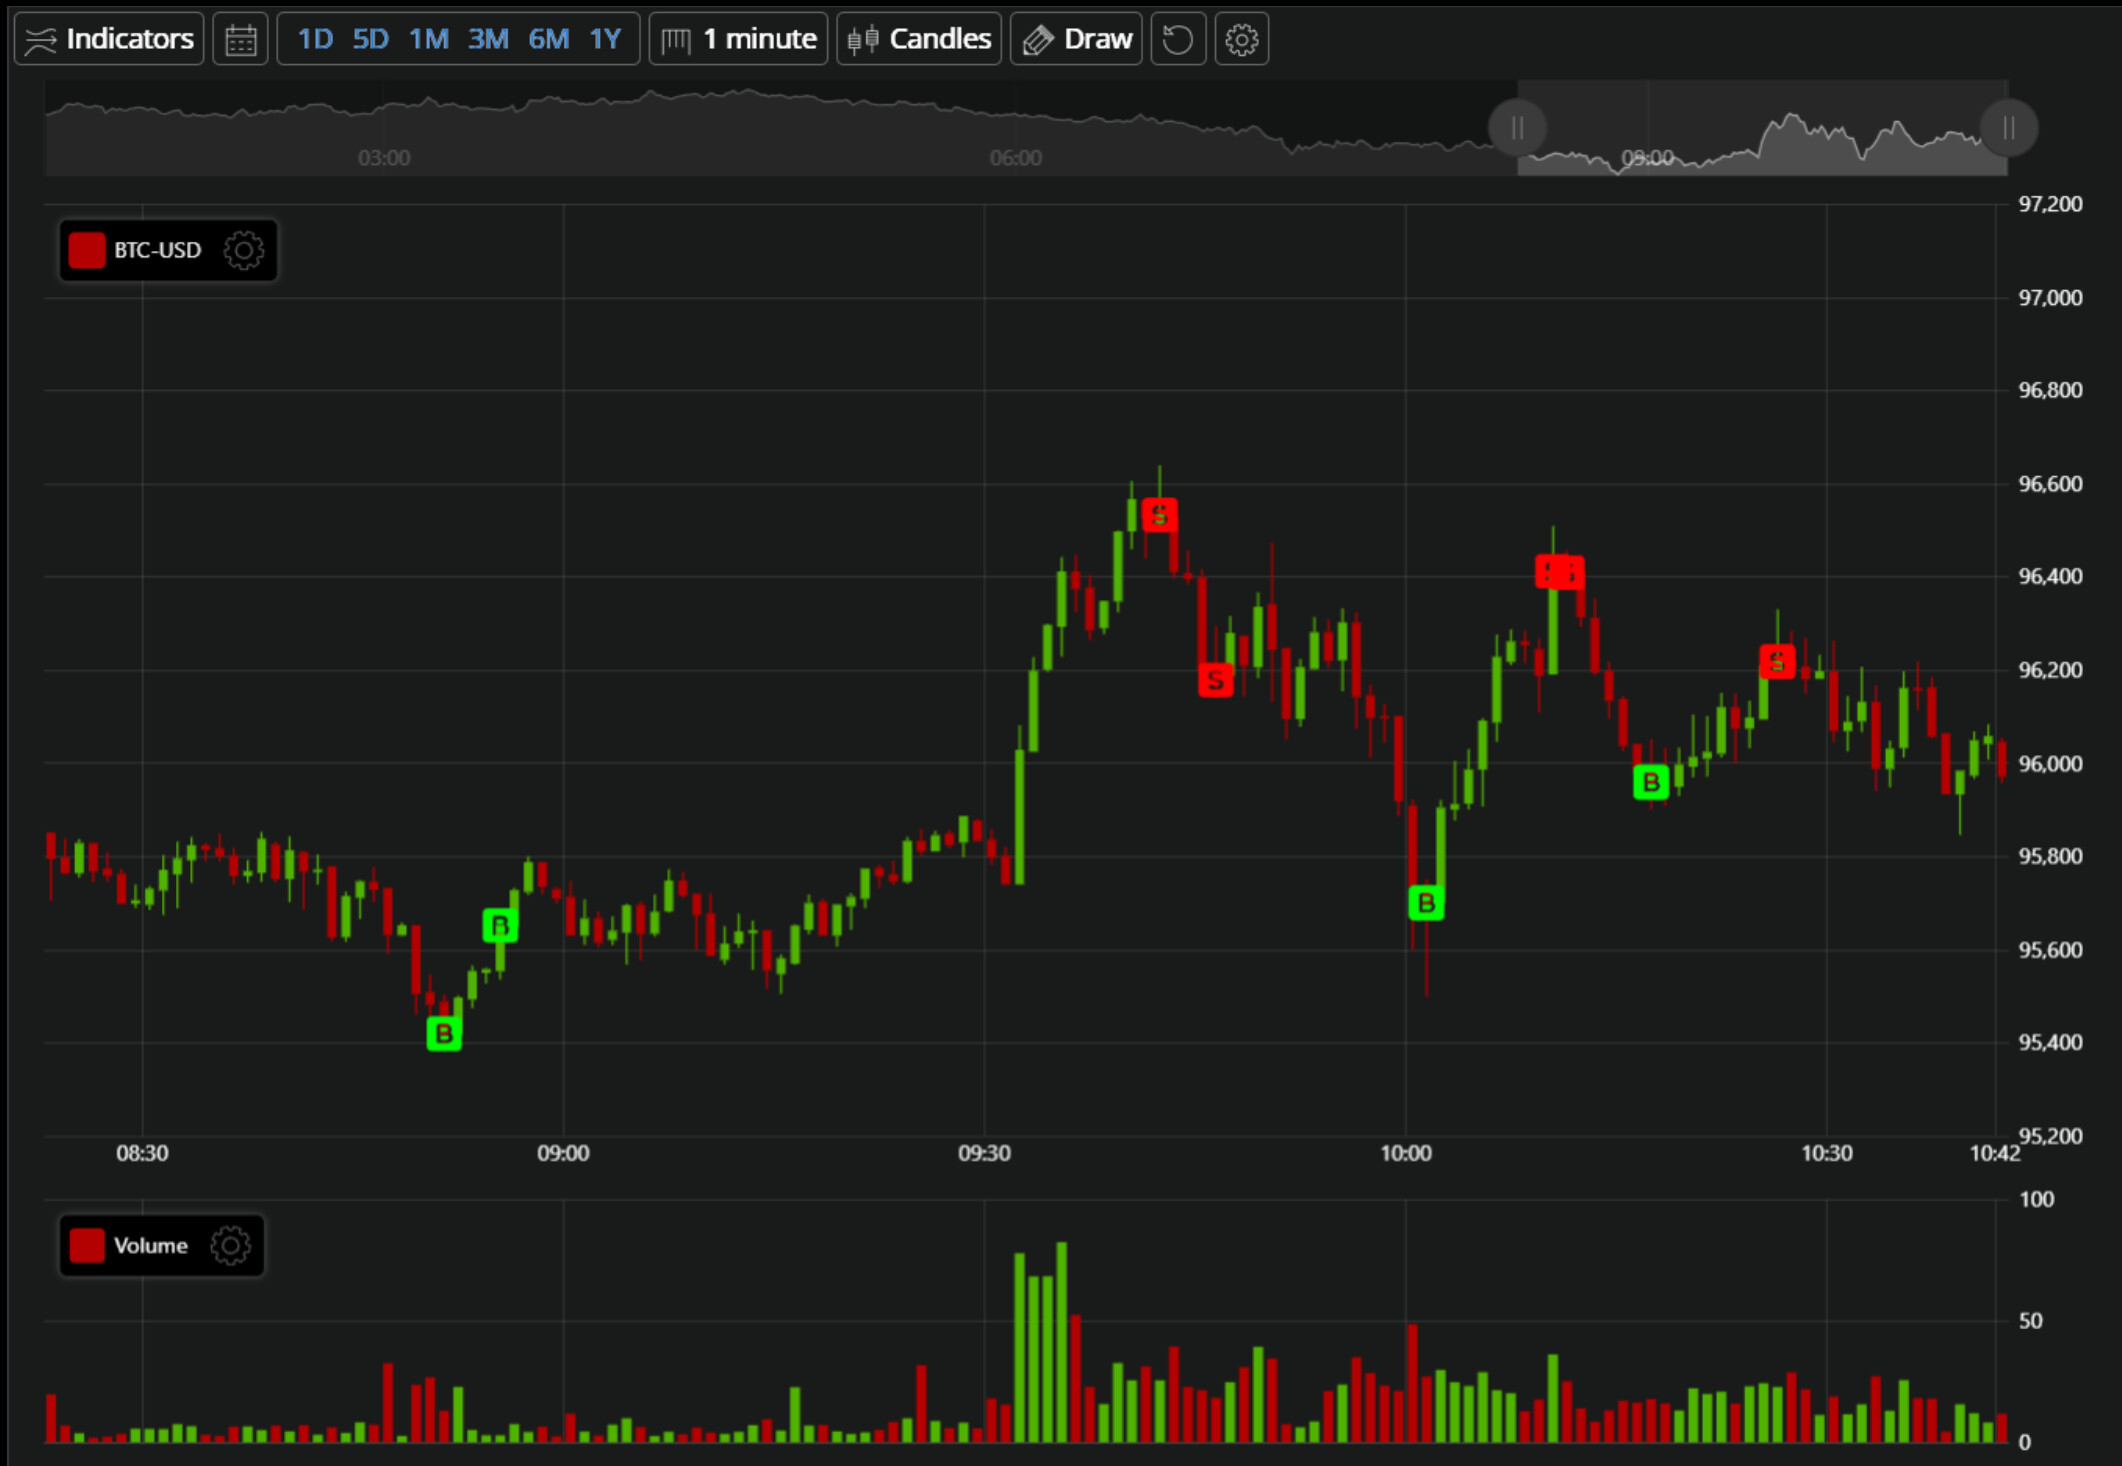
The Price Chart occupies the main area of the trader display, offering a comprehensive view of price movements and trading activity.
Price Bars
- The chart displays price bars based on the current time period specified in the controls (e.g., 1-minute, 5-minute, hourly, etc.).
- Each bar represents the open, high, low, and close prices for its respective time period.
Pause Functionality
- You can pause the chart using the button located at the bottom left corner of the screen.
- When paused, the chart stops updating in real-time, allowing you to analyze historical data without interruptions.
Dragging and Scrolling
- Drag the chart left or right to navigate through historical data. Additional data will load automatically as needed.
- Use your mouse’s scroll wheel to zoom in or out. The time period for each bar will adjust dynamically to provide an optimal view.
Vertical Zoom
- Drag the price axis on the right side of the chart up or down to zoom in or out on the vertical price range. This helps you focus on specific price levels.
Cursor Legend
- Hover over any price bar with your cursor to view its details in the legend.
- The legend displays:
- Open Price
- High Price
- Low Price
- Close Price
Volume Display
- The bottom section of the chart shows trading volume as bars corresponding to each price bar.
- The volume legend provides additional details, including:
- The total number of Bitcoin bought and sold during each time period.
Trade Markers
- Your trades (or trades from a selected trader you are following) are represented as markers on the chart:
- Green markers indicate Buy trades.
- Red markers indicate Sell trades.