The Tick Chart is a unique feature of the Quantzu app, designed to give users a granular view of individual trades and their characteristics. This chart can be accessed directly within both the browser and mobile versions of the app and offers a detailed, real-time visualization of market activity.
How to Access the Tick Chart
To switch from the main bar chart to the tick chart:
- Click the “Tick Chart” button located in the lower-right corner of the screen.
Features of the Tick Chart
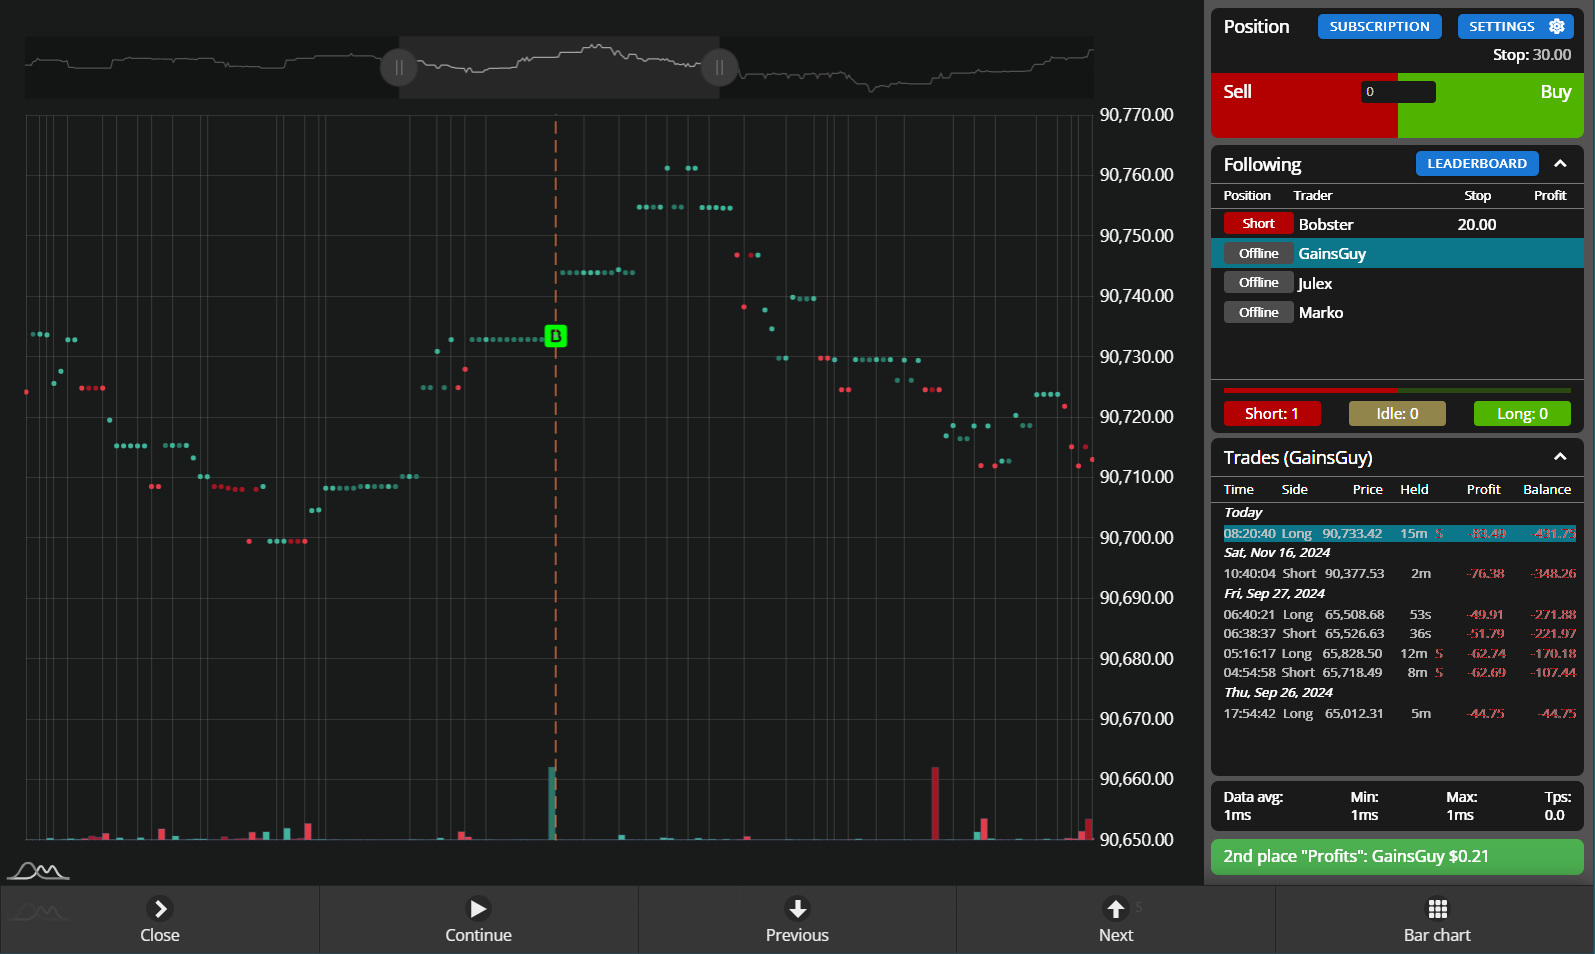
Trade Representation
- Dots: Each dot represents an individual trade.
- Green dots: A buy at the ask price.
- Red dots: A sell at the bid price.
- Lighter-colored dots: Indicate that the time of trade is identical to the previous trade (likely part of a larger order).
- Bars at the bottom: Represent trade sizes, giving a visual indication of volume.
Light Vertical Lines
- These vertical lines extend from the top to the bottom of the chart and are spaced 500ms apart, but their spacing may appear uneven due to varying numbers of trades within each time span.
- Hover your mouse over any point on the chart to view details such as:
- Exact time of the trade.
- Trade size.
Interaction and Navigation
The tick chart retains all interaction features from the main bar chart:
- Dragging: Drag left, right, up, or down to navigate through the chart.
- Zooming: Use your mouse wheel to zoom in and out.
- Trade Buttons and Panels: All trade buttons, panels, popups, and bottom buttons function identically to those on the main bar chart.
Additional Features
- Pause Functionality: The tick chart can be paused just like the bar chart.
- Trade Markers: Trade markers can be displayed on this chart for added clarity.
- Indicators: Note that indicators do not display on this chart.
Use Case
The tick chart is especially useful when anticipating market reversals. Its detailed view allows traders to execute trades at precise moments by analyzing individual trade activity in real time.
Returning to the Bar Chart
To switch back to the main bar chart:
- Click the “Bar Chart” button located in the lower-right corner of the screen.
The tick chart is a powerful tool for advanced traders looking to gain deeper insights into market dynamics. Explore its features to enhance your trading strategy with Quantzu!