Chart Scroller
The chart scroller is a powerful navigation tool that enhances your ability to analyze price action in our app. Here’s a quick guide to understanding and using this feature:
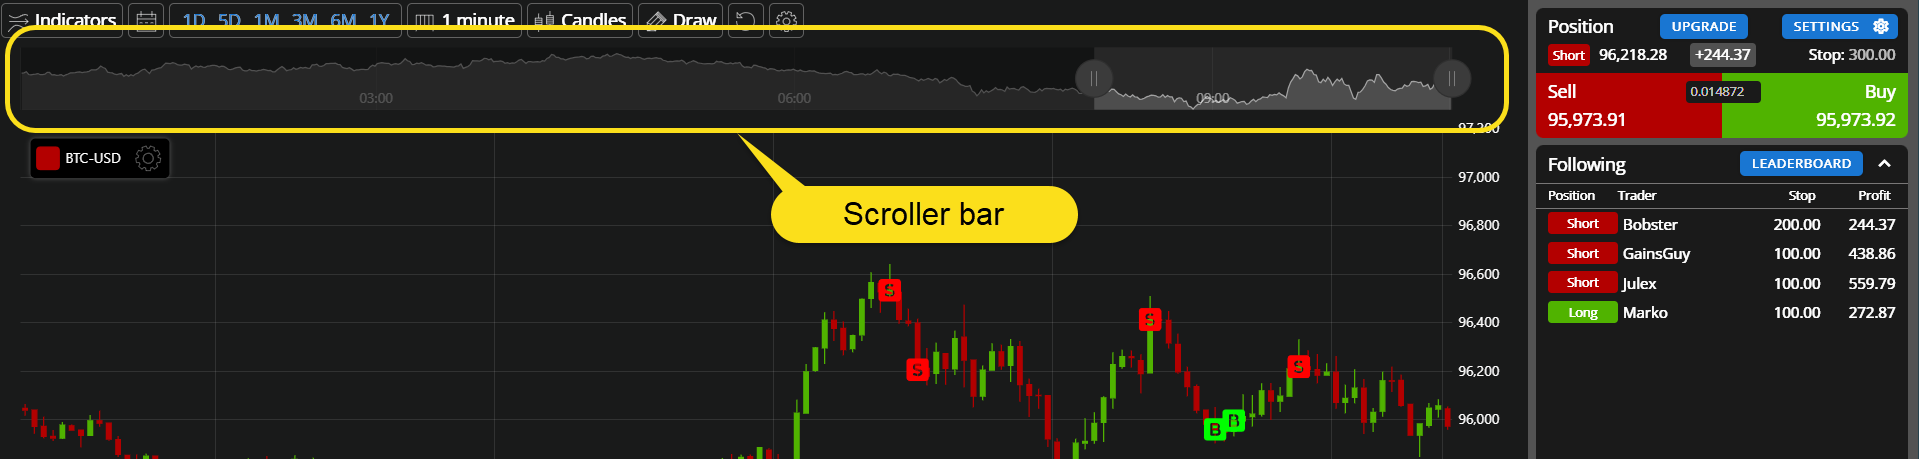
Location and Purpose
- Placement: The chart scroller is conveniently located across the top of the price chart.
- Function: It provides an extended view of price action over a longer period, giving you a broader context for your analysis.
Key Features
- Visible Window Highlight
- The currently visible portion of the chart is clearly highlighted in the scroller.
- This helps you quickly identify which section of the extended timeline you’re viewing.
- Navigation Controls
- Sliding: You can easily move the visible window left or right to navigate through different time periods.
- Expanding: Adjust the size of the visible window by dragging either end to zoom in or out on the main chart.
- Quick Jump
- Click on any point within the chart scroller to instantly move the main window to that specific time period.
How to Use
- Navigating Through Time:
- Grab the highlighted area in the chart scroller and slide it left or right to move through different time periods.
- Adjusting the View:
- To zoom in or out, click and drag either end of the highlighted area to expand or contract the visible window.
- Instant Time Travel:
- For quick navigation, simply click on any point in the chart scroller. The main chart will immediately jump to that time period.
By mastering the chart scroller, you’ll be able to efficiently analyze price trends, compare different time frames, and gain valuable insights into market behavior.