Chart Controls Documentation
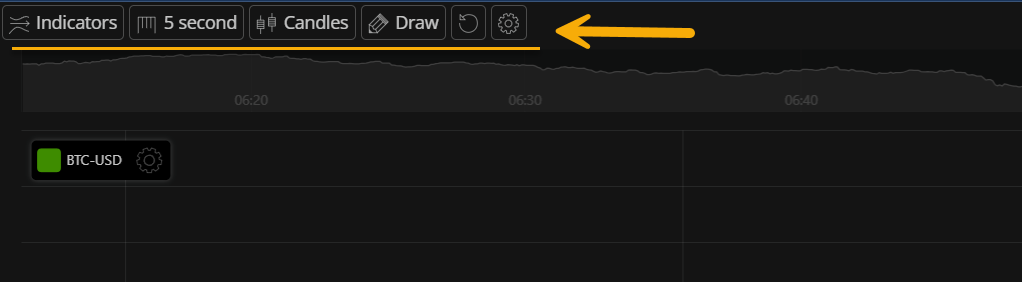
The chart controls panel in your crypto trading contest app provides users with powerful tools to customize and analyze their trading charts. This panel is conveniently located in the top-left corner of the screen and includes a variety of features to enhance your charting experience. Below is a detailed description of the available controls.
Chart Controls Panel Overview
The chart controls panel contains the following tools:
Indicators
- Description: A dropdown list featuring over 30 technical indicators.
- Purpose: Add indicators to the chart to assist with market analysis and trading decisions.
- Examples: Moving averages, RSI (Relative Strength Index), Bollinger Bands, MACD (Moving Average Convergence Divergence), etc.
Bar Size
- Description: Adjust the size of each bar on the chart.
- Options: Choose from time intervals ranging from 1 second to 1 day.
- Purpose: Tailor the granularity of the chart to suit your trading strategy, whether you’re analyzing short-term movements or long-term trends.
Candle Style
- Description: Customize the visual style of the chart.
- Options: Switch between different candle styles or display lines instead of candlesticks.
- Purpose: Change how price data is represented for better readability or personal preference.
Draw
- Description: Tools for drawing directly on the chart.
- Features:
- Draw lines to highlight trends or support/resistance levels.
- Add arrows to mark specific points of interest.
- Purpose: Annotate and analyze chart data visually.
Reset
- Description: A one-click option to clear all customizations.
- Functionality:
- Remove all added indicators.
- Erase all drawings from the chart.
- Purpose: Quickly revert the chart back to its default state for a fresh start.
Trading Controls
Click the buy/sell buttons or the chart with any of these keys pressed down:
- buy/sell buttons
- click: immediate at market, deletes smartOrder
- ctrl-click smart order (for min fee)
- ctrl-shift-click place order on price drop(sell), jump(buy)
- alt-click: cancel smart order
- clears limit lines
- click on chart create verticle orange line
- shift-click erase verticle line
- alert lines on chart
- ctrl-click: alert line (no trade)
- ctrl-shift-click: trigger order at that price (colored and longer bars)
- alt-click reversal (colored, longer, 3px)
Gear (Settings)
- Description: Advanced settings for scaling and visualization.
- Options:
- Change the scale of the chart to percentage or logarithmic views.
- Add time band fills for better visualization of specific periods.
- Purpose: Fine-tune the chart’s appearance and functionality for more precise analysis.
By utilizing these controls, users can fully customize their charts to suit their trading style and improve their ability to analyze market data effectively. Whether you’re a beginner or an experienced trader, these tools will help you gain deeper insights into price movements and make informed decisions during your crypto trading contests.